Mining Omics Signatures for Human Health and Disease
Omics data present unique challenges, including sparsity, over-dispersion, high dimensionality, and complex inter-feature dependencies. Our lab develops statistical, computational, and AI methods that robustly and effectively handle these complex data structures across the full analytical pipeline and a variety of study designs.
Data Integration: Modern omics studies are typically large in scale and span multiple studies. To achieve reliable population-level inference, sophisticated data integration methods are required to eliminate unwanted variation while preserving true biological signals. We develop methods that address both measured artifacts (e.g., batch effects) and hidden heterogeneity (e.g., latent subtypes), thereby minimizing spurious findings and enhancing sensitivity for true signal discovery in downstream analyses.
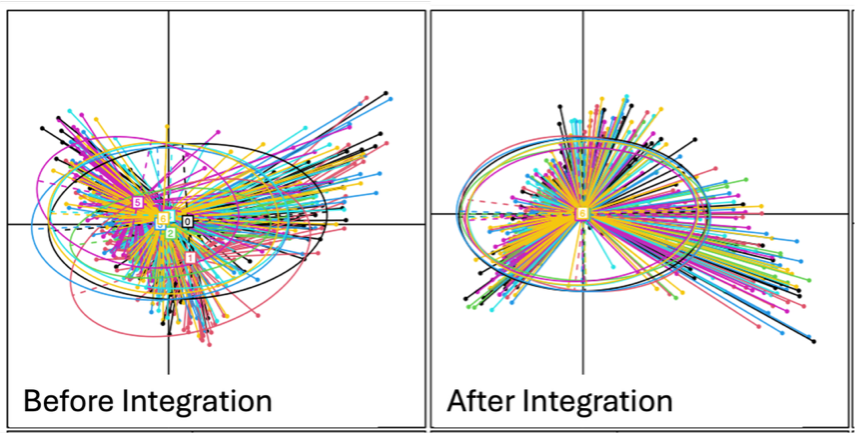
PCoA plots of six batches (Batch 0–5) before and after data integration. Batch effects are effectively removed, enabling reliable analyses on the processed data with minimal regard for unwanted artifacts.
Data Visualization: Omics data visualization is critical for both data exploration and communication of scientific findings, yet it remains challenging due to the high dimensionality and irregular distributions inherent to omics data, as well as the added complexity of advanced study designs. We develop visualization methods that are robust to these data and study characteristics while remaining flexible enough to highlight effects of interest, e.g., plotting microbiome trajectories over time while appropriately adjusting for potential confounding factors.
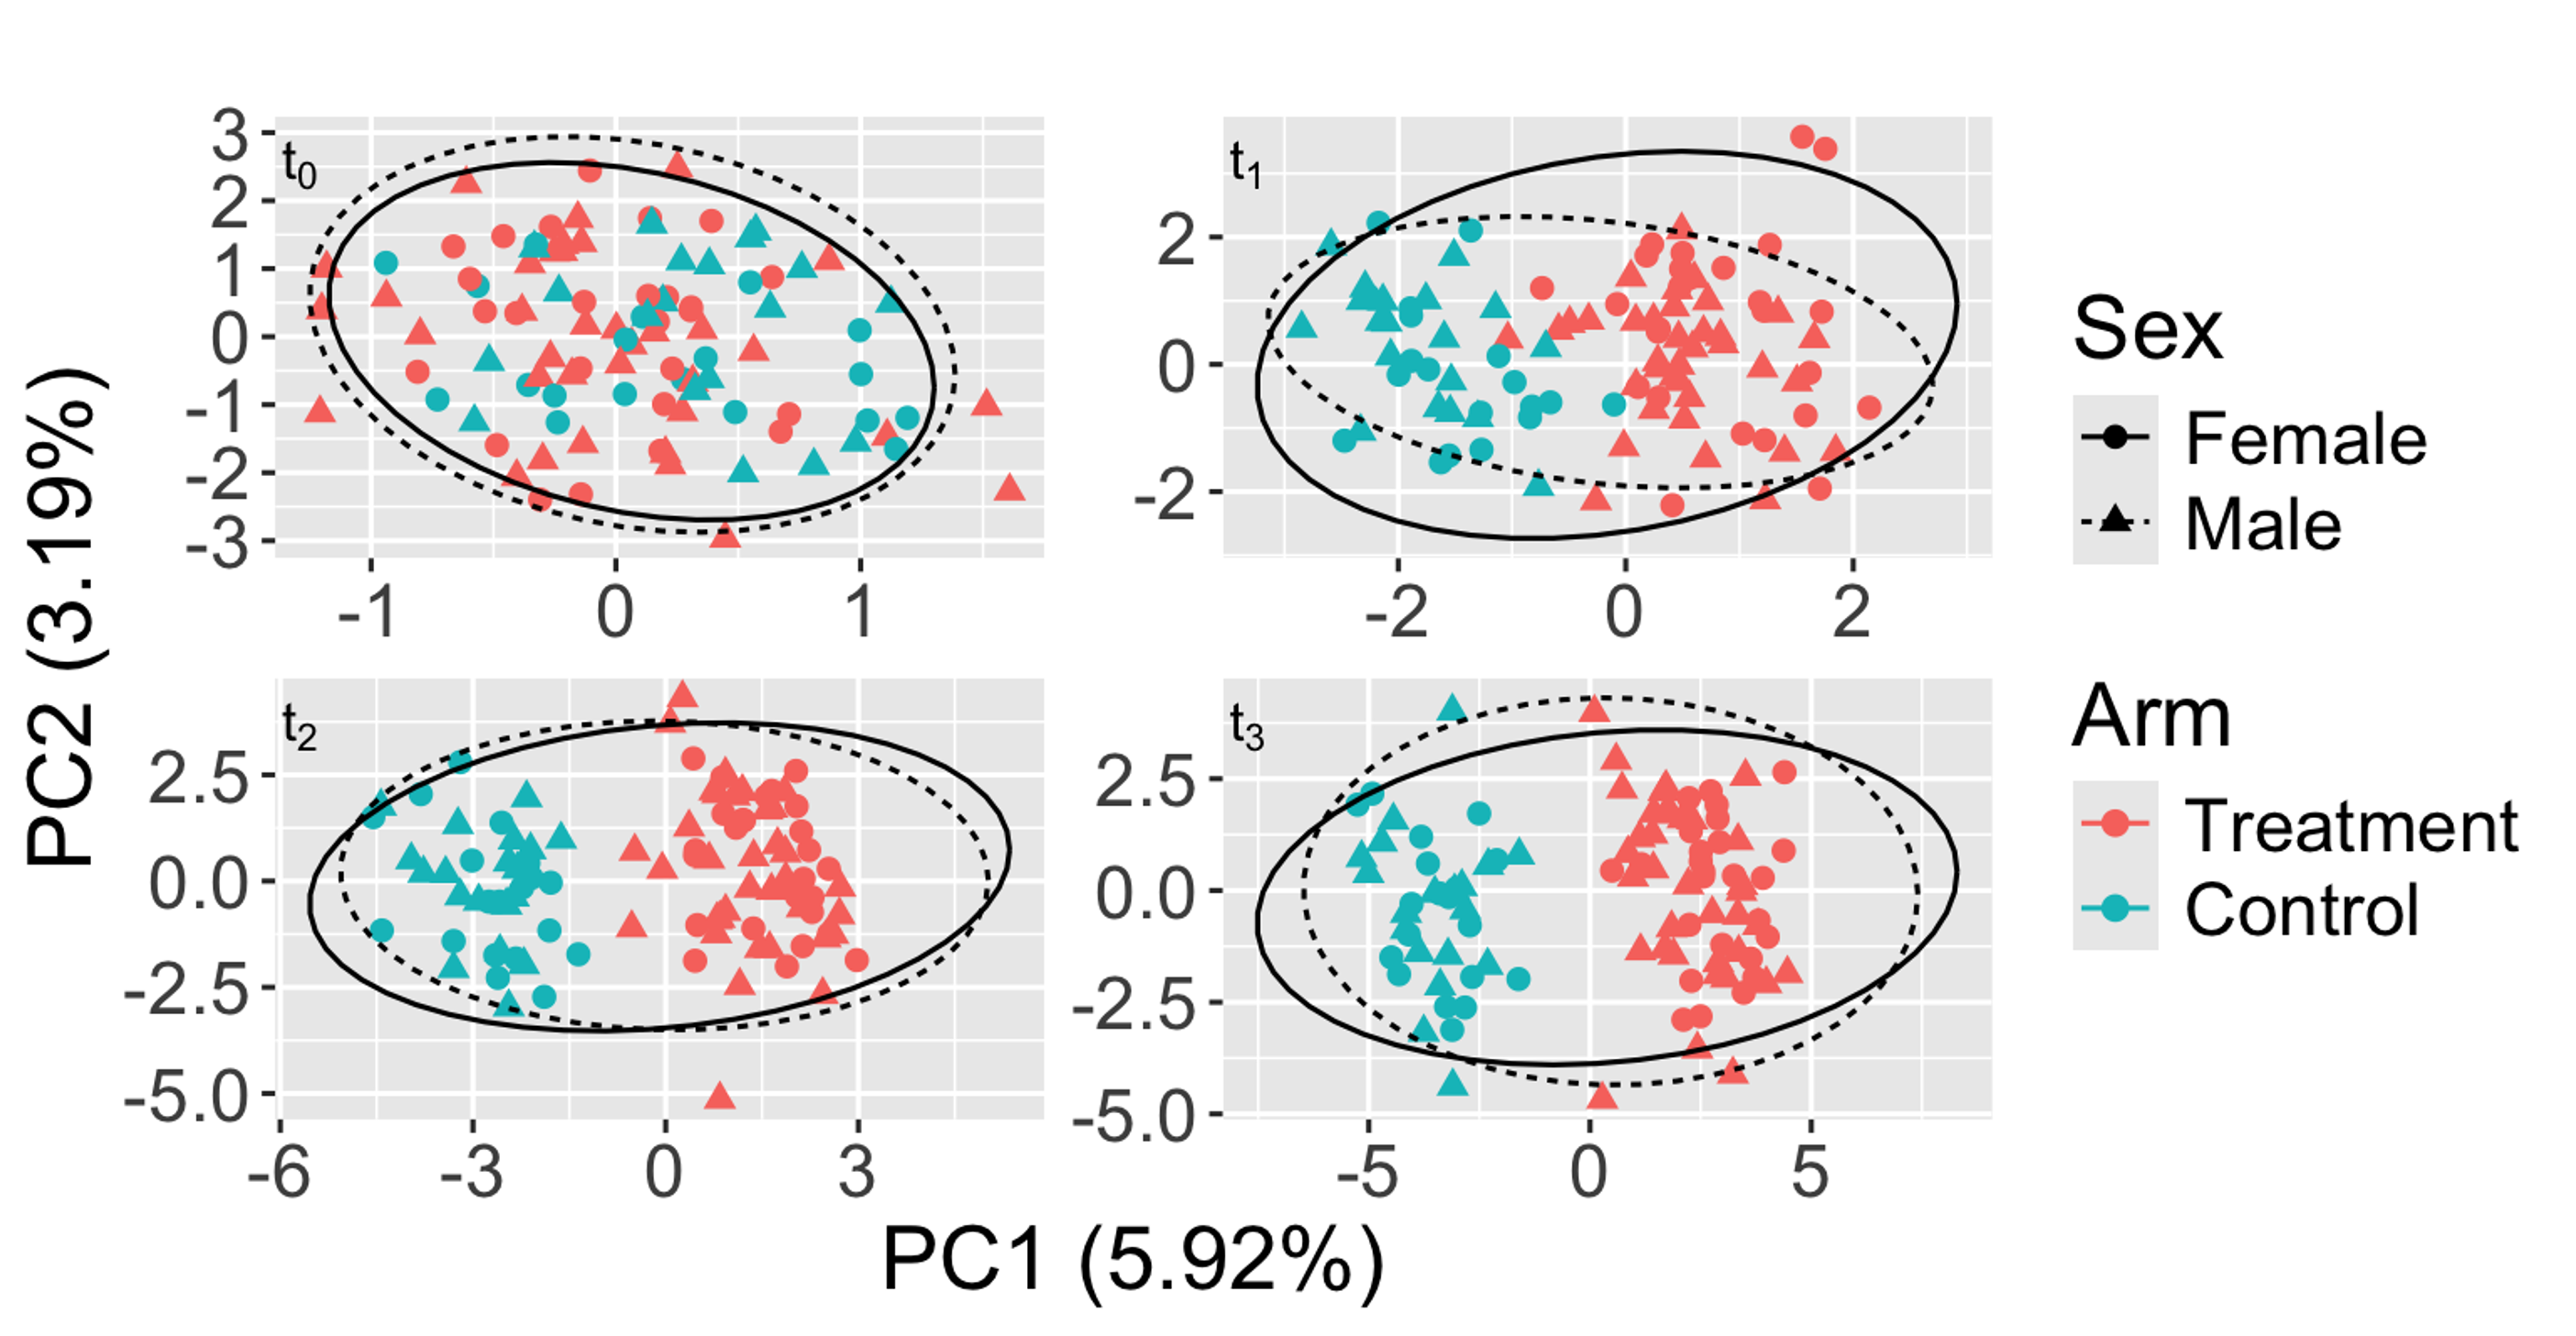
Adjusted PCoA plot from a synthetic longitudinal microbiome study in which sex obscures the treatment effect. The impact of the unwanted confounder (sex) is minimized, while the treatment effect over time (t0 to t3) is highlighted.
Signature Discovery: A central goal of omics analysis is to identify individual features, pathways, or community-level characteristics, such as microbiome alpha and beta diversity, that are associated with exposures or outcomes of interest. We develop methods that are robust to challenging omics data characteristics, maximizing the sensitivity of signature discovery while rigorously controlling false positive discoveries. Beyond detecting simple location shifts, our methods are able to uncover heterogeneous association patterns, such as subgroup-specific effects linked to exposures or outcomes.
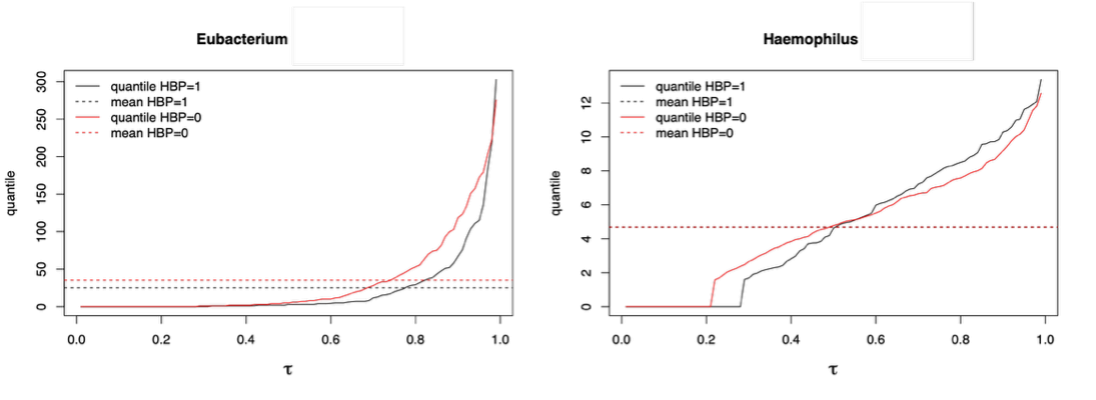
Examples of gut bacterial genera with heterogeneous associations with hypertension identified exclusively by our method. Empirical quantiles are plotted against quantile levels, stratified by hypertension status, with dashed horizontal lines indicating group means, which are similar or identical. Hypertension is associated with lower Eubacterium at high abundance, and with lower Haemophilus at low abundance but higher Haemophilus at high abundance. These diverse associations are likely driven by diverse species- or strain-level effects.
Omics-Based Diagnosis and Prediction: Disease diagnosis and prediction based on omics profiles are important objectives in clinical applications. Effectively extracting information from high-dimensional, interdependent, and irregularly distributed omics data to predict outcomes of interest remains a long-standing challenge. We develop novel deep learning architectures that explicitly leverage the structural characteristics of omics data to learn optimal embeddings for accurate prediction. More recently, we have begun tailoring LLMs to further enhance predictive performance by leveraging the embedded knowledge within the pretrained foundation models.
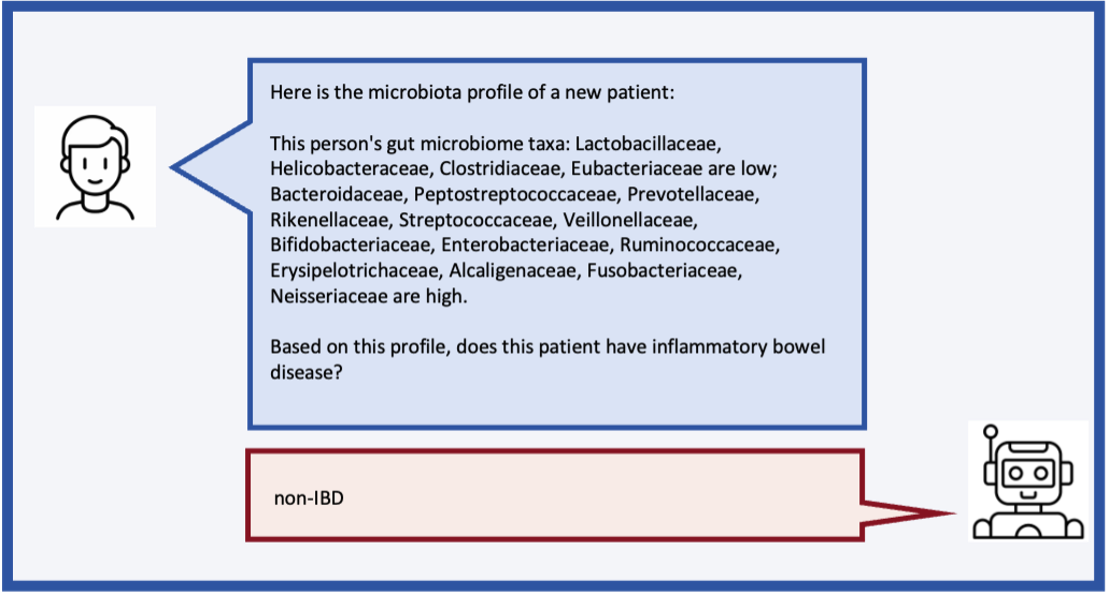
Illustration of the final step in our knowledge-guided LLM tool for microbiome-based IBD diagnosis.
Spatially Resolved Omics Analysis: Recent technological advances have introduced spatial resolution to omics profiling, enabling a more nuanced understanding of disease pathology. We work closely with established researchers in the fields of spatial transcriptomics and spatial proteomics, and we are at the forefront of developing the first generation of computational tools for spatial microbiome data to understand spatial dysbiosis, microbe-microbe interactions, and microbe-host interactions.
Integrating Multi-Omics for a Comprehensive Understanding
Our lab also develops methods for multi-omics data to enable a more comprehensive understanding of human health and disease.
Interactions Across Omics: Biological processes are inherently coordinated and context-dependent across molecular layers, making the study of cross-omics interactions important for elucidating the mechanisms underlying health and disease. We develop methods, particularly for microbiome-host genome interactions, including microbiome quantitative trait loci (mbQTLs), to identify host genetic drivers of both overall microbiome composition and individual bacterial taxa. Our methods are not only statistically robust and powerful, but also scalable and computationally efficient for such ultra-large-scale analyses.
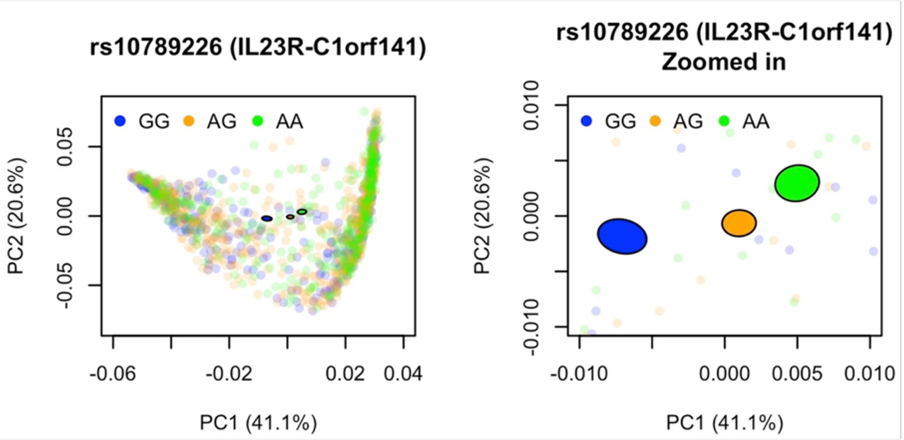
PCoA plot of the gut microbiome, with the percentage of variance explained by each component shown, colored by genotypes of the top variant in the significant IL23R–C1orf141 region. A 95% confidence ellipse is constructed for each genotype. An enlarged view of the confidence ellipses is displayed on the right.
Joint Multi-Omics Signature Discovery: Identifying joint multi-omics signatures associated with exposures or outcomes of interest is a critical yet challenging problem. A long-standing challenge lies in assessing the aggregate effects of multiple omics with complex interactive effects under complex study designs, such as those involving family clustering. We develop sophisticated statistical methods that achieve high sensitivity while rigorously controlling false positive discoveries.
Virome Analysis: The virome is an integral yet understudied component of the microbiome, for which analytical tools remain limited. We focus on developing computational and AI methods for upstream tasks, such as defining appropriate analysis units and data preprocessing, to enable reliable downstream analyses, particularly virome-host phenotype and virome-bacteriome interaction studies.
Omics Analysis in Therapeutic Areas
Our lab actively collaborates with biomedical researchers across a range of therapeutic areas, including cardiovascular disease, aging-related conditions, organ transplantation, cancer, and women’s health, and has established a strong and sustained record of interdisciplinary accomplishment. We apply state-of-the-art methods to analyze real-world experimental and clinical data, and we also develop novel methods to address scientific questions that were previously intractable. For example, we developed a predictive tool that identifies microbial signatures, defined as balances or geometric means of two groups of taxa, to forecast infection risk following transplant surgery.
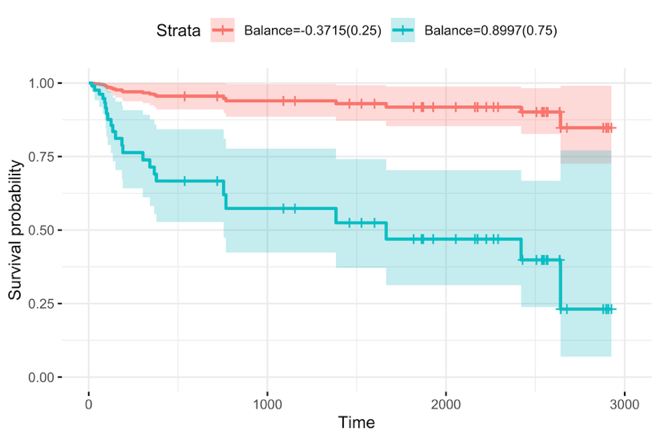
Kaplan-Meier estimates of overall survival among hematopoietic cell transplantation recipients, stratified by low vs. high values of the selected gut microbiome balances.
Selected Grants
Ongoing:
R01 GM155734, NIH/NIGMS, PI (09/2024–07/2029)
R01 GM151301, NIH/NIGMS, Co-I/Subcontract PI (09/2023–07/2027)
R44 HL167294, NIH/NHLBI, Co-I/Subcontract PI (07/2024–06/2026)
R01 NS140142, NIH/NINDS, Co-I (11/2024–10/2029)
R01 AI184528, NIH/NIAID, Co-I (05/2024–03/2029)
R01 DK139249, NIH/NIDDK, Co-I (03/2024–01/2029)
R01 CA248747, NIH/NCI, Co-I (04/2021–03/2026)
NF 231850, Novartis Foundation, Co-I (06/2023–03/2026)
Completed:
R41 AI176963, NIH/NIAID, Consultant (02/2024–01/2026)
R56 AG085541, NIH/NIA, Co-I (09/2024–08/2025)